We draw some one-dimensional graphs of motion versus time in this article. If objects move in a plane or three-dimensional space, we can decompose their motions into some one-dimensional motions along the coordinate axes.
Graph of displacement vs time
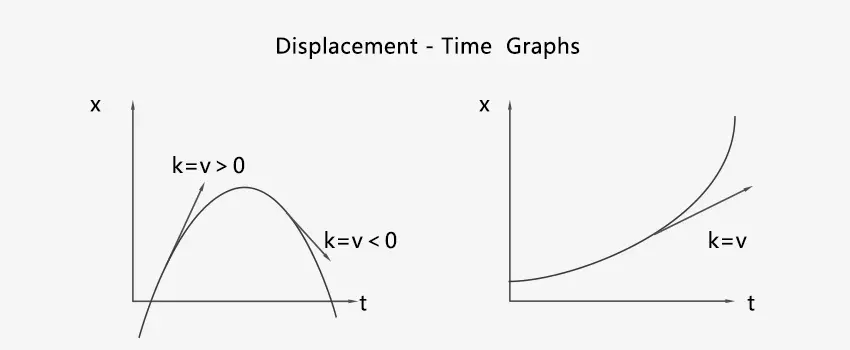
The horizontal axis represents time and the vertical axis represents object displacement with respect to the origin. The slope of the curve is, which is obviously the instantaneous velocity of object.
If k = v < 0, the object moves in negative direction. If k=v>0, the object moves in positive direction. If k = 0, the velocity of object is zero.
If the curve lies above the t-axis, the displacement is positive. If the curve lies below the t-axis, the displacement is negative.
Concave function ⇔ a < 0, the acceleration direction is opposite to the x-axis. Convex function ⇔ a > 0, the acceleration direction is the same as the x-axis.
Graph of velocity vs time
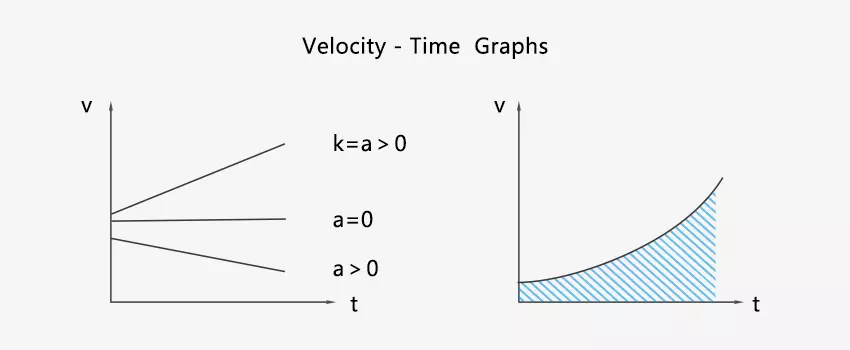
The horizontal axis represents time and the vertical axis represents velocity. The slope of the curve is, which is obviously the instantaneous acceleration of the object.
If k = a < 0, the acceleration direction is opposite to the v-axis (negative direction). If k = a>0, the direction of acceleration is the same as the v-axis (positive direction). If k = 0, the acceleration is zero. It accelerates only when the velocity and acceleration are in the same direction. Otherwise it decelerates.
If the curve lies above the t-axis, v > 0, the object moves in the positive direction. If the curve lies below the t-axis, v < 0, the object moves in the negative direction.
The area enclosed by the velocity curve f(t) and the time axis represents the displacement.
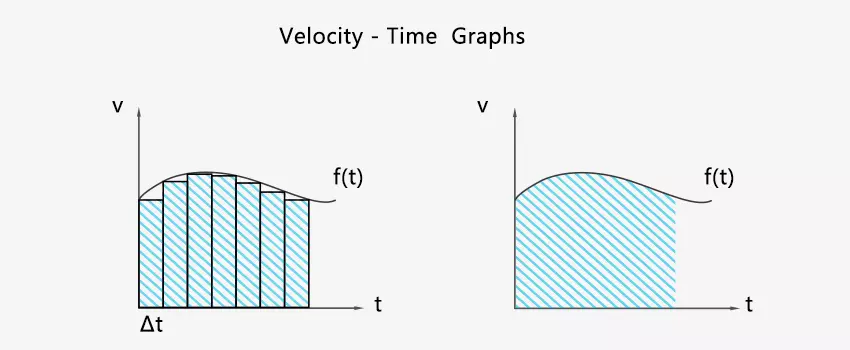
We can divide the time axis into some segments of same length with the value Δt. The value of each rectangle area represents the magnitude of displacement in Δt. The sum of these rectangle areas equals the total displacement. The velocity in each Δt interval is replaced by the instantaneous velocity at the starting moment of Δt. This operation is inaccurate, as evidenced by the gap between rectangles and curve f(t). When Δt tends to zero, you can imagine that these rectangles approach the curve infinitely and their error vanishes.
Graph of acceleration vs. time
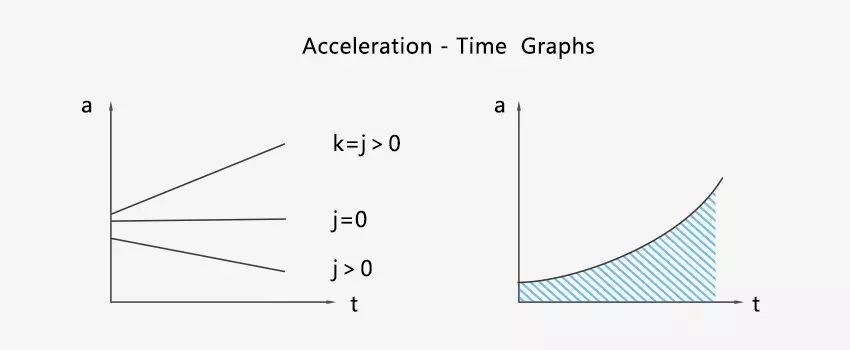
The horizontal axis represents time and the vertical axis represents the acceleration of object. The slope of the curve is. It corresponds to a physical concept called jerk which is used to evaluate the comfort of motion.
Similar to the velocity-time graph, the area enclosed by the acceleration curve and the time axis represents the velocity.